
Radar Statistics
The optional radar chart allows you to monitor your training process and results at a glance. You can see the training proportion and collected data about your pink muscles, white muscles and oxygen intake etc. You will be able to feel the result of your workout and know which part of the muscles you’re working on.
Exercise Computing
The “On Cloud Computing” will provide you related statistics and charts, and switch between different pages, you can see very clearly how much time you spent on rower, on jogging or on training your hip flexors!
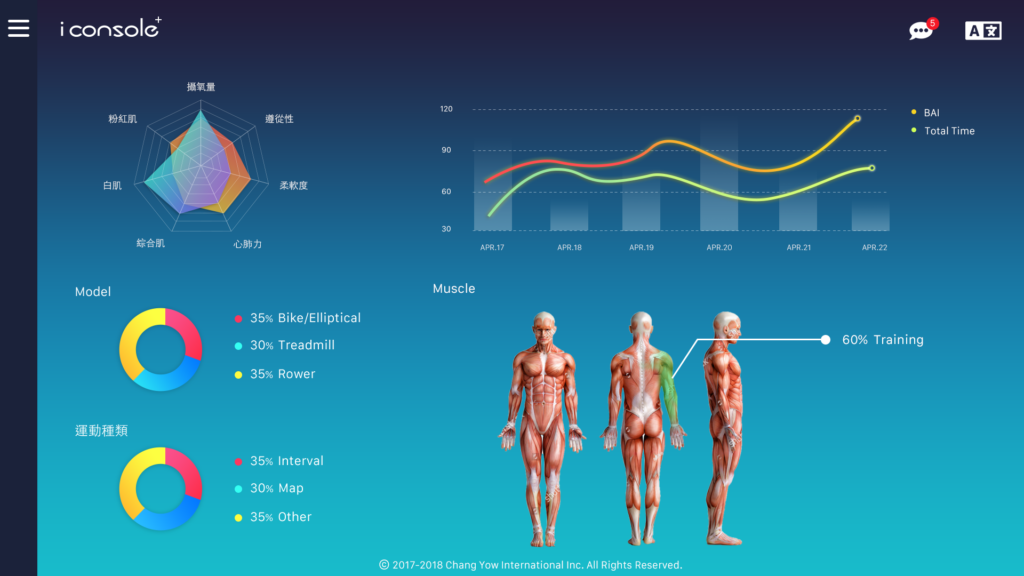
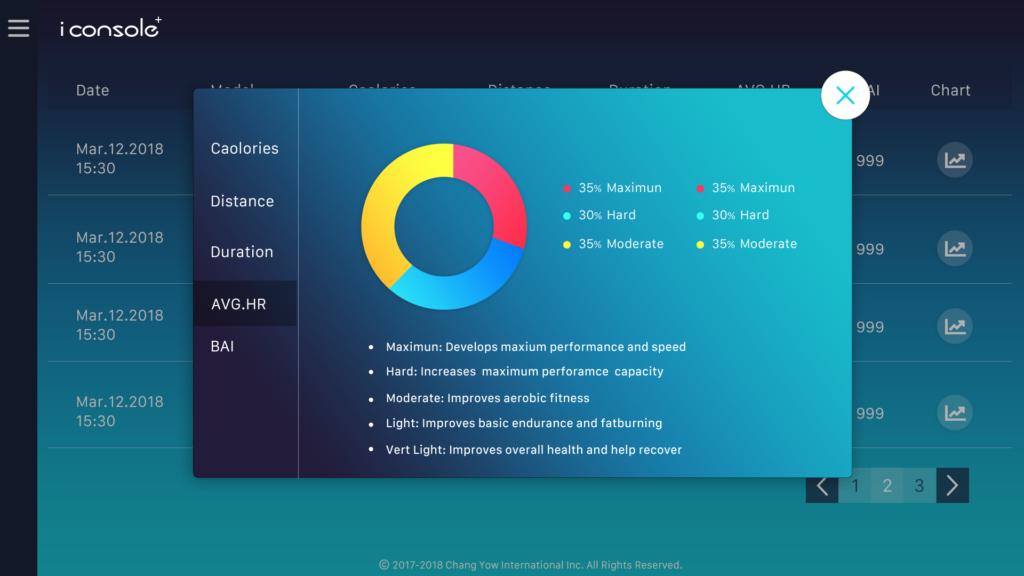
Anatomy Chart
We categorize the muscles group into 7 groups (22 groups in AI diagnosis version), head muscles, upper arm muscles, lower arm muscles, upper chest muscles, lower abdominal muscles, thigh muscles, lower calf muscles. You can click and read the analysis to see which muscle group you were working on the proportion.

AI Diagnosis
AI (Artificial Intelligence Motion Diagnosis, as the name suggests, we combine its own Random Forest and Classification algorithm as a training model for machine autonomous learning, apply personal training and norm training data to the training, and then generate a post-training model that meets its own different goals, so that customers can insert their own physical conditions with target natural language, and generate different customized receipt and training suggestions.
A.I. (Artificial Intelligence)
We have always believed that the ultimate goal of exercise is to improve one’s health. Other exercise such as weight loss, jogging, games are all designed to achieve this goal. We work toward that goal by using various devices on the market and more diverse sensor detection, pairing with the algorithm and statistic from the cooperation with domestic medical institutions to make it more readable, easier to implement and operate, in order to bring you a better and more effective training experience.